VBOX TOOLS SOFTWARE - FUNCTIONS
The VBOX Tools Graph Screen facility allows VBOX files to be viewed and compared in windows: a main graph window, a data table window and a map window.
Using the data table the logged parameters can be plotted against either time or distance and displayed on the graph window. The graph also offers a facility to extract minimum, maximum, average and delta values between points in the viewed data. In addition to the logged parameters, a number of calculated channels (such as lateral acceleration and longitudinal acceleration) can be displayed.
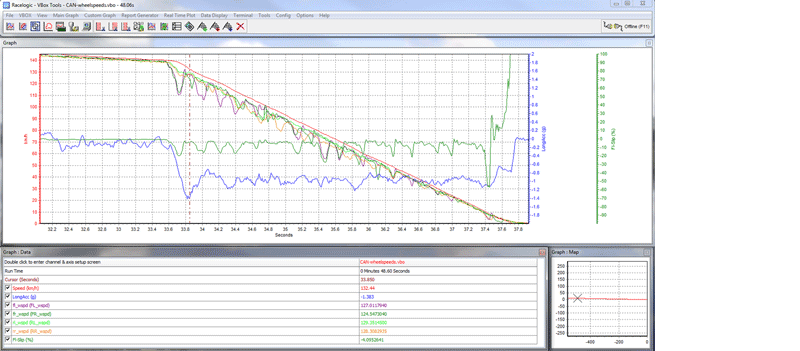
The map window shows the path of the vehicle, calculated from the latitude and longitude data, and in combination with the graph window can be used to define start/finish lines, and split points. A circuit overlay can be applied to the map window, allowing you to see the position of the vehicle in relation to the edges of the track.
Each of the three display windows can be resized by stretching the window, and all of these windows can be printed. All of the parameters logged by the VBOX can be displayed, and the colours of each line can be customised.
Up to three additional files can be loaded and displayed at the same time, making data comparison a quick and easy process.
If the data file was logged by a Video VBOX a video player window will also open.
A 'live window' is a display window that can display data from a VBOX channel in real-time or from a logged channel in a VBOX file. The live windows can be placed anywhere on the screen and each may be set to one of six different display types. The colour and format of these windows can also be adjusted.
The map window shows the path of the vehicle, calculated from the latitude and longitude data, and in combination with the graph window can be used to define start/finish lines, and split points. A circuit overlay can be applied to the map window, allowing you to see the position of the vehicle in relation to the edges of the track.
Each of the three display windows can be resized by stretching the window, and all of these windows can be printed. All of the parameters logged by the VBOX can be displayed, and the colours of each line can be customised.
Up to three additional files can be loaded and displayed at the same time, making data comparison a quick and easy process.
If the data file was logged by a Video VBOX a video player window will also open.
The VBOX Tools Graph Screen facility allows VBOX files to be viewed and compared in windows: a main graph window, a data table window and a map window.
Using the data table the logged parameters can be plotted against either time or distance and displayed on the graph window. The graph also offers a facility to extract minimum, maximum, average and delta values between points in the viewed data. In addition to the logged parameters, a number of calculated channels (such as lateral acceleration and longitudinal acceleration) can be displayed.
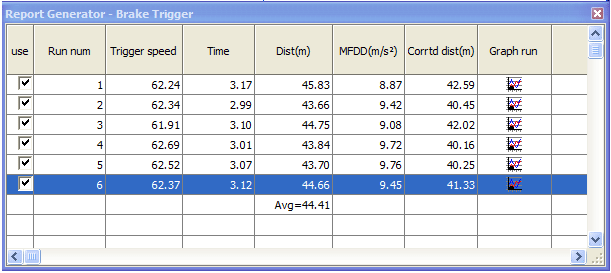
The Report Generator is the main "numbers engine" in the VBOX Tools software, and is designed to create a highly configurable table of results.
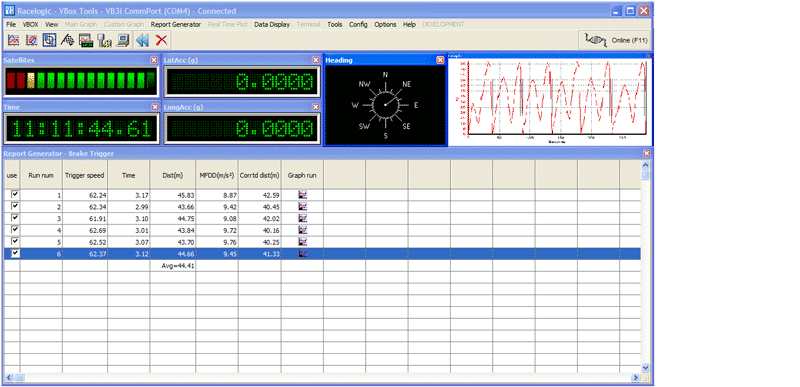
The Report Generator works on a previously logged '.vbo' file or in real-time connected to the VBOX.
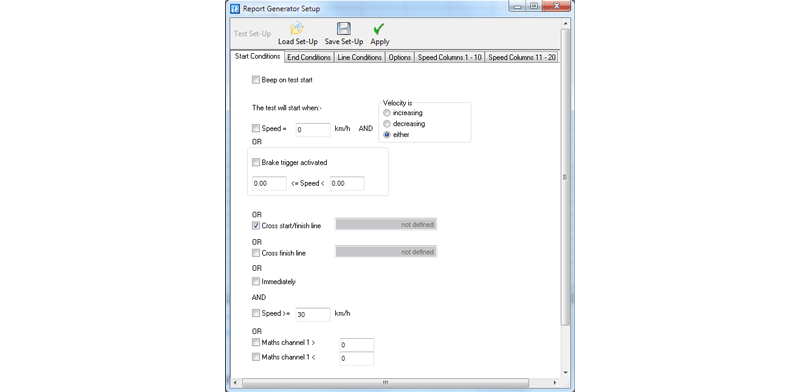
There are comprehensive test start, end and line triggers based on speed, time, distance, virtual gates and external triggers. The columns of the table can contain any parameter logged by the VBOX, and may also show maximums, minimums, and averages. The scale and offset of any channel is also configurable.
For example, if a number of brake stops using a brake trigger are recorded onto a compact flash card and loaded into the software, all brake trigger stops in the file can be displayed in a table.